Newspapers
Explore the visualization and how we made it, and afterwards reflect on the discussion questions.
Select the images below to explore the frequencies of words used in newspaper articles about Native Americans from the 1600s to present. Then, try it yourself in the linking map!
 |  |
|---|---|
 |  |
 |  |

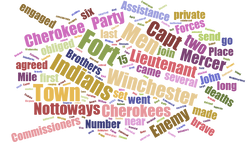
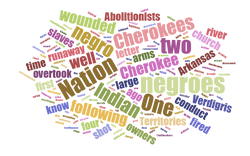
A look at terms used to describe people in the articles from each century. How have the words used changed over time?

This graph shows the frequency of the eight common terms in each century's article over the length of each article. What do you notice?
A look at terms used to describe people in the articles from each century. How have the words used changed over time?
Try exploring the corpus of words yourself by finding new terms to plot on the linking map!
Visualization
We gathered the newspaper articles from the following databases: America's Historical Newspapers (articles from 1690, 1756, and 1856), The New York Times (articles from 1956), and Lexis Nexis (articles from 2015). We pulled enough articles so that the lenth of words for each century was roughly the same (600-800 words).
We used Voyant Tools to visually depict the data. In order to focus on key words, we decided to redact the plain text of each article by removing the following types of words: articles, auxiliary verbs, conjunctions, prepositions, and pronouns. We also standardized irregular spelling (for instance, the articles from 1690 used -'d instead of -ed for past tense verbs).
The purpose of this visualization was for us to see if any trends in popular opinion concerning Native Americans could be seen in the newspapers. What we have tentatively concluded from the data is that Indians have been thought of in terms of the historical context. For example, the earlier eras, which were involved with expansion and wars of the European settlers amongst each other, reflect militarized language (e.g., "enemy", "fort"), the articles from 1856 reflect the concerns of slavery at the brink of the Civil War, and the terms from more modern day culture reflect an emphasis on preservation and educational efforts to preserve Native American culture. The limitations of such conclusions include the fact that the data set is quite small; it would be interesting to upload a larger corpus and see if any of this trends from randomly selected articles holds true on a larger scale.
The Making of...
How do these visualizations of verbal data and words compare and contrast with the graphical data of numbers found on the Population page? Do these similarities and differences relate to the qualitiative and quantitative forms of research and analysis?
Are there any connections you see amongst the popular terms for articles about Indians over the centuries and some of the cultural changes in food, clothing, and shelter as seen from the Tribes subpages? How might the historic events and popular opinion have affected Native American culture, specifically as it relates to food, clothing, and shelter?
Do you think a handful of articles taken from across the centuries is a fair representation of popular opinion at that time?
What is the value of researching random articles and putting them through a verbal visualization tool, versus simply reading of trends in popular opinion in a history or textbook?
What did you learn from exploring the linking map tool?